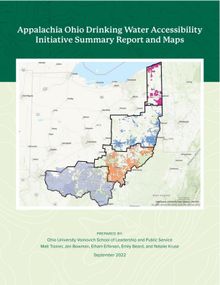
Appalachia Ohio Drinking Water Accessibility Initiative Summary Report and Maps
 PDF
PDF
Prepared by: Ohio University Voinovich School of Leadership and Public Service
Matt Trainer, Jen Bowman, Elham Erfanian, Emily Beard, and Natalie Kruse, September 2022
The Voinovich School of Leadership and Public Service at Ohio University along with partners from the local development districts, the Governor’s Office of Appalachia, and the Environmental Protection Agency has produced a set of 32 county-level maps identifying coverage areas served and not served by an improved public water source in Appalachia Ohio. From the data collected as part of this initiative in Appalachia Ohio, the average percent of population unserved by a public water system is 34%, distinctly higher than the national average at 12%.
The goal of the initiative was to create a database and set of maps that shows communities that are served and unserved by public water, providing leaders and decision makers the information needed to elevate and address the issue to improve water accessibility in Appalachia Ohio. These maps are available for download here, click on a county to download the map showing coverage areas served and not served by a public water source and the county-level infographic displaying socioeconomic data for each of those populations.
Questions can be directed to Jen Bowman, bowmanj2@ohio.edu and Matt Trainer, trainer@ohio.edu at Ohio University Voinovich School.
